Imagine helping astronomers read the light of distant galaxies from your phone. The first challenge might be a bright streak or a strange double blob: is it useful information from the universe, or something the telescope introduced?
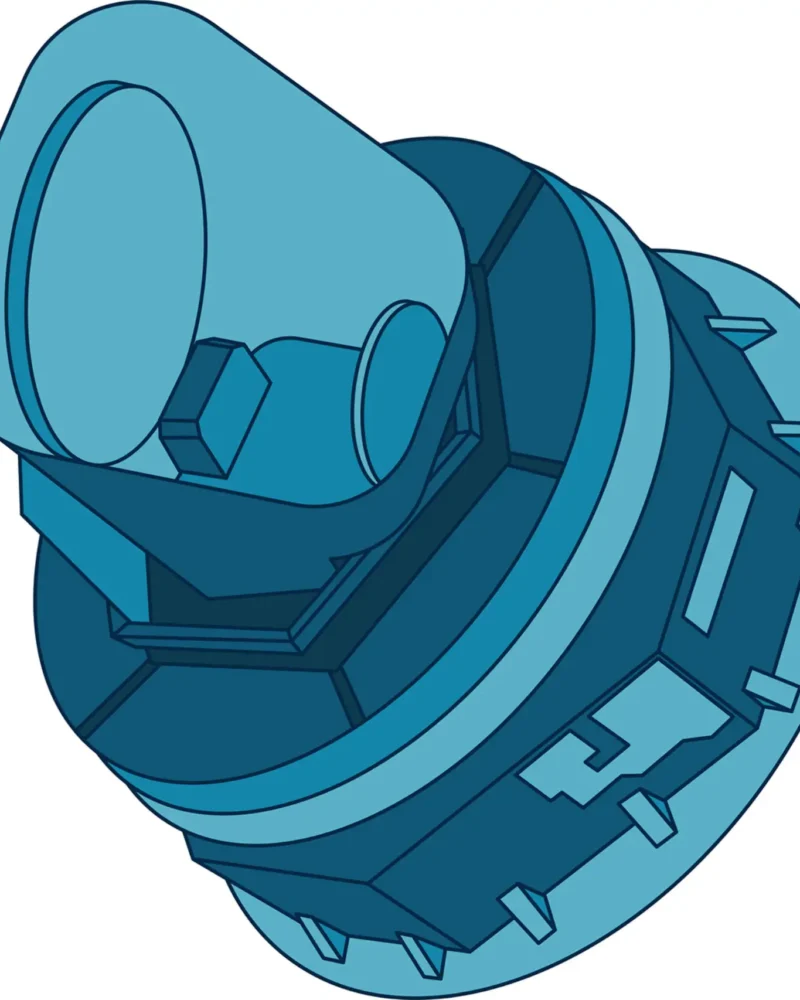
A NASA-funded citizen-science project called Artifact InSPECtor is asking volunteers to help answer that question. It uses observations from the European Space Agency’s Euclid mission to improve the way computers recognise unwanted features in telescope data. The work is also preparation for NASA’s upcoming Nancy Grace Roman Space Telescope.
NASA highlighted the project on September 11. Its introductory tutorial takes about 10–15 minutes, according to NASA’s participation guide, and no previous astronomy knowledge is required.
Keep exploring
Continue with Curiosmos
Why do these galaxies look like streaks?
The observations are spectra: light separated by wavelength. Instead of a familiar portrait of a spiral galaxy, volunteers encounter small sections of data containing streaks and bright spots. Each can carry a different piece of information.
A telescope instrument called a grism spreads light into a spectrum. Particular elements produce distinctive emission lines, bright features at particular wavelengths. Recognising those patterns helps astronomers investigate a galaxy’s properties and measure its redshift, an important step in estimating its distance.
There is a complication. Some light passes through the instrument without being spread out. In the Euclid data used here, it can produce paired blobs resembling an infinity symbol. These are additional images created by the optics, rather than two newly discovered galaxies. Understanding that distinction is part of learning to read the observations.
A blue patch is a prediction worth checking
The project’s computer model marks regions it considers artifacts. Volunteers examine those proposals and judge whether the model has identified them correctly. Stray light, detector effects and energetic particles can all leave features that complicate the scientific measurement.
The research team explains that volunteers can compare data before and after a processing step called continuum subtraction. This removes the background level of a spectrum to make brighter emission features easier to distinguish. Comparing the two views helps reveal whether a spot belongs to an emission line, an artifact or an imperfect subtraction.
That is where a human decision becomes useful. A bright mark deserves interpretation in context; its brightness alone does not tell us what produced it.
What happens to the classifications?
The researchers use a version of the Segment Anything Model, originally developed to identify regions in everyday images. Its training did not make it an expert in these particular astronomical observations. Volunteers’ assessments will help the team refine its ability to recognise artifacts in grism data.
The intended result is a model that masks unsuitable regions while preserving useful measurements. The team plans to make it available through the Roman Research Nexus so astronomers working with Roman observations can use it. This is an intended outcome of the project, rather than a finished scientific result.
How to take a look yourself
Open Artifact InSPECtor on Zooniverse and choose “Identify Artifacts.” Work through the tutorial before making classifications; its examples explain the features and the questions you will encounter. NASA lists a computer, tablet or phone with an internet connection as the equipment needed. The project’s Talk forum provides a place to discuss unfamiliar examples with other volunteers and the team.
We checked the public project and its research explanation for this report, but did not submit classifications. The invitation is an unusual one: help improve the tools that astronomers will use to interpret enormous numbers of galaxies. Before those galaxies can tell their stories, someone has to work out which marks belong to their light.