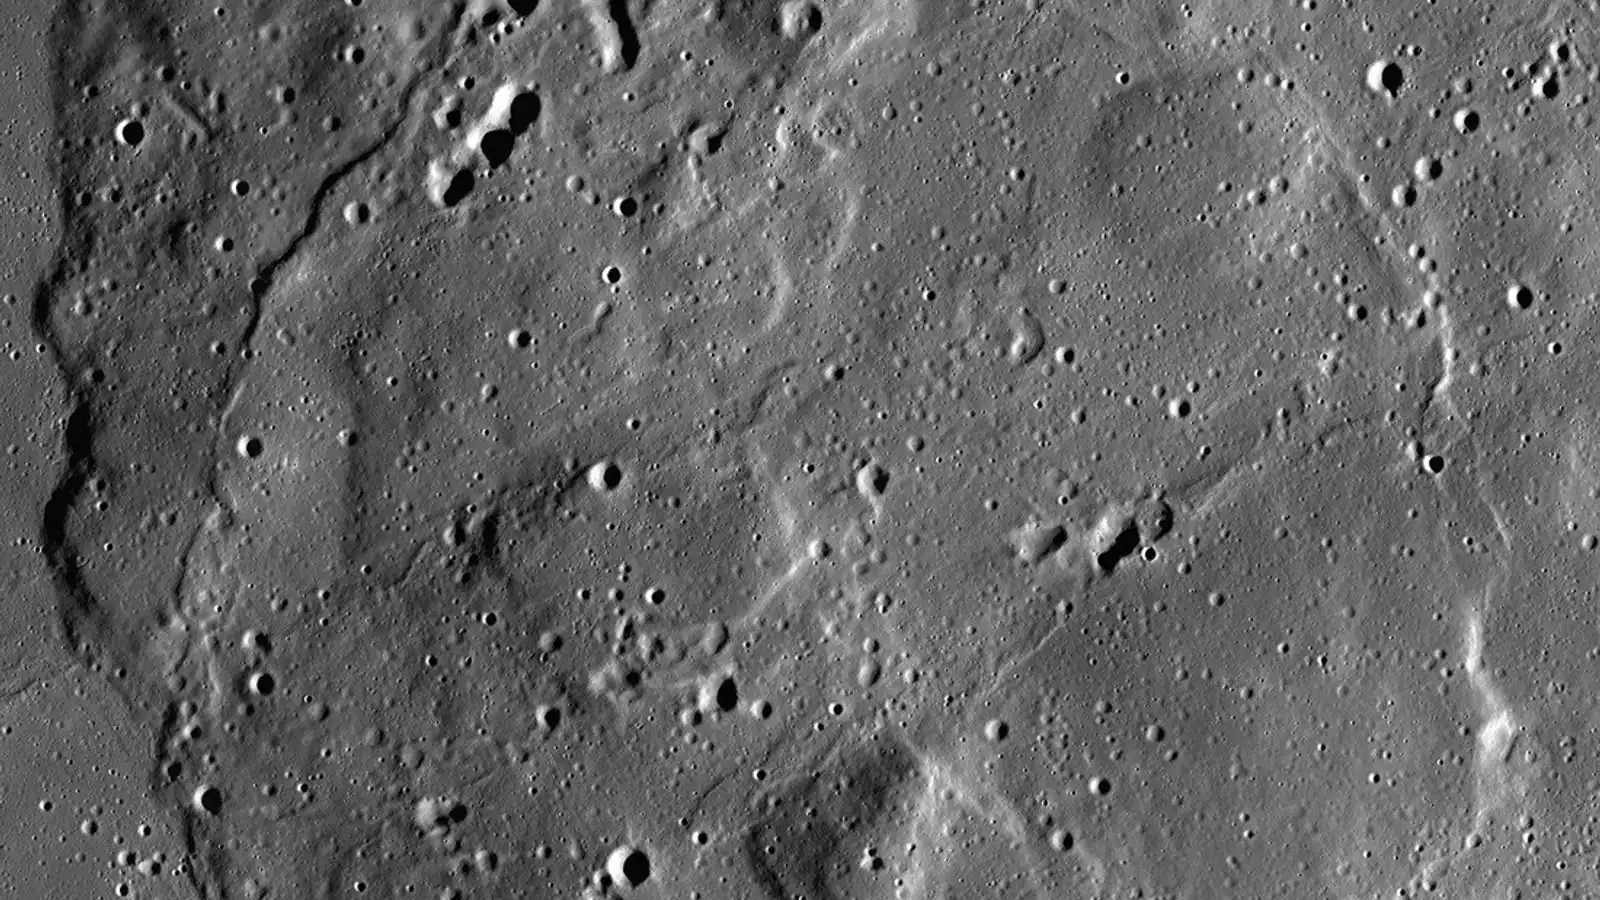
What could we learn by looking again at millions of images of the Moon? NASA and IBM have released an artificial-intelligence model designed to help researchers search that enormous archive for craters, volcanic features and patterns relevant to polar ice.
The September 10 announcement describes a system trained on roughly two million lunar image tiles, drawing heavily on the Lunar Reconnaissance Orbiter. Its promise is to make existing observations more useful: scientists can adapt a common model to particular research questions instead of starting each task from scratch.
One of its most interesting applications comes with an essential distinction. A map showing where ice might persist is a guide to an investigation. It is not a new measurement of frozen water.
Teaching a model to read a changing landscape
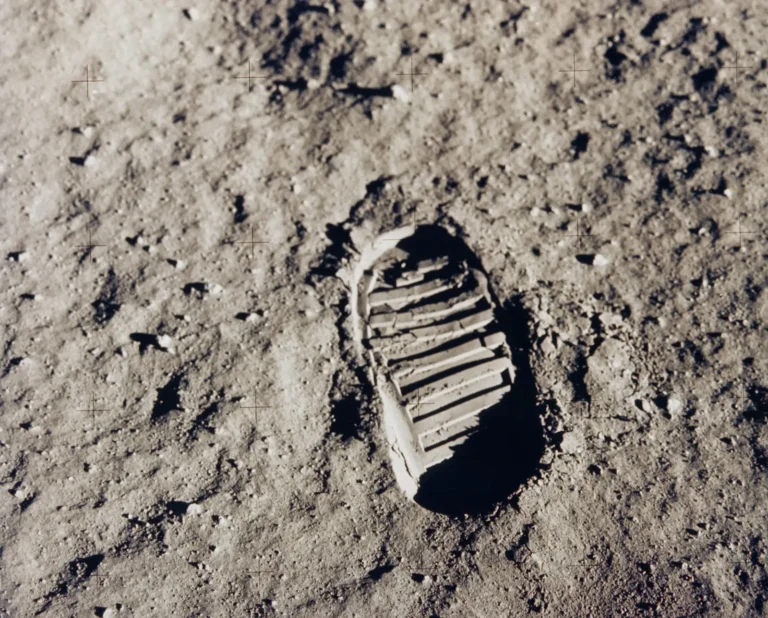
The Moon can look dramatically different as the direction of sunlight changes. A crater rim that stands out in one observation can become much harder to recognise in another. Shadows are part of the information, but they also complicate comparisons.
The team’s technical model description explains that lighting geometry is supplied explicitly alongside the observations. The training also combines different kinds of imagery and terrain information, rather than relying on visible appearance alone.
That design gives researchers a starting point for specialised tasks. They can adapt it to identify craters or outline irregular mare patches, unusual volcanic features whose appearance helps scientists investigate the Moon’s geological history. The published comparisons show that performance depends on the task; the lunar model is not uniformly superior in every test.
What an ice-prospectivity map actually means
The polar application combines eight kinds of information, including terrain slope, temperature-related constraints and the distribution of permanently shadowed regions. It estimates a continuous prospectivity score across the mapped surface.
According to the released ice-model documentation, the target it learns to reproduce is an existing, knowledge-based model. Its output is therefore an estimate built from assumptions about favourable conditions, rather than an inventory of ice deposits.
The distinction makes the reported performance easier to understand. A closer match to the reference map demonstrates that the system can reproduce that map’s patterns. It does not mean a spacecraft has confirmed water wherever the colour is most promising.
The released polar version operates within ten degrees of each pole at a scale of 240 metres per pixel. Its documentation also says it has not been validated for operational decisions such as landing-site selection or rover route planning.
A better way to decide where to look?
NASA illustrates another possible use with images taken before and after a rocket-body impact near Einstein crater. The post-impact observation was excluded from pre-training, allowing the researchers to test adaptation to a newly changed surface. Such work could help identify changes across large image collections.
The broader opportunity is to move more quickly from an archive to a scientific question. Which features deserve closer inspection? Where do different kinds of observations agree? Where does a prediction fail when checked against another measurement?
The model and supporting resources are public, allowing other researchers to test those questions. A colourful map is the beginning of that process. The interesting discoveries will come from following its suggestions back to the Moon’s actual terrain.